Financing Sources - Introduction
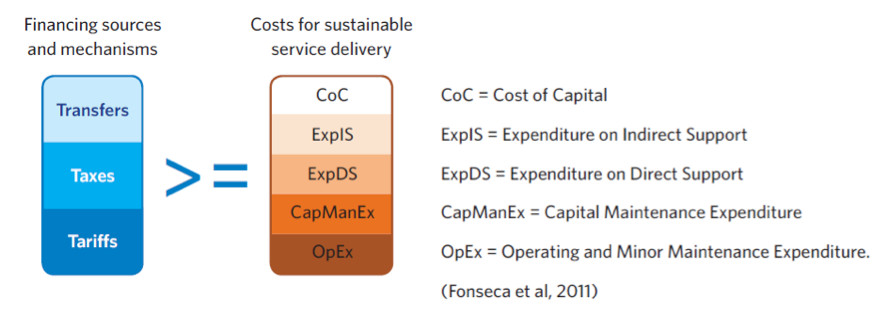
The main financing sources to recover the costs of water, sanitation and hygiene service delivery are (a combination of) taxes levied by national governments, transfers made by development partners and tariffs paid by users of a services (see figure 1). These financing sources in the water and sanitation sector are also known as the three Ts (e.g. taxes, transfers and tariffs).
Note that the figure is not meant to represent relative magnitude of costs.
Transfers refer to funds from international donors and charitable foundations (including NGOs, decentralized cooperation or local civil society organizations) that typically come from other countries (GLAAS, 2012). These funds can be contributed in the form of grants, concessionary loans (i.e. loans that include a “grant” element in the form of a subsidized interest rate or a grace period) or guarantees.
Tariffs are funds contributed by users of W water, sanitation and hygiene services for obtaining the service (GLAAS, 2012). Users generally make payments to service providers for getting access to the service and for using the service. When the service is self-provided (e.g. when a household builds and operates its own household latrine), the equity invested by the household (in the form of cash, material or time, sometimes referred to as “sweat equity”) would also fall under tariffs.
Taxes refer to funds originating from domestic taxes that are channelled to the sector via transfers from all levels of government; including national, regional and local (GLAAS, 2012). Such funds would typically be provided as subsidies, for capital investment or operations. “Hidden” forms of subsidies may include tax rebates, soft loans (i.e. loans at a subsidized interest rate) or subsidized services (e.g. subsidized electricity).
Examples
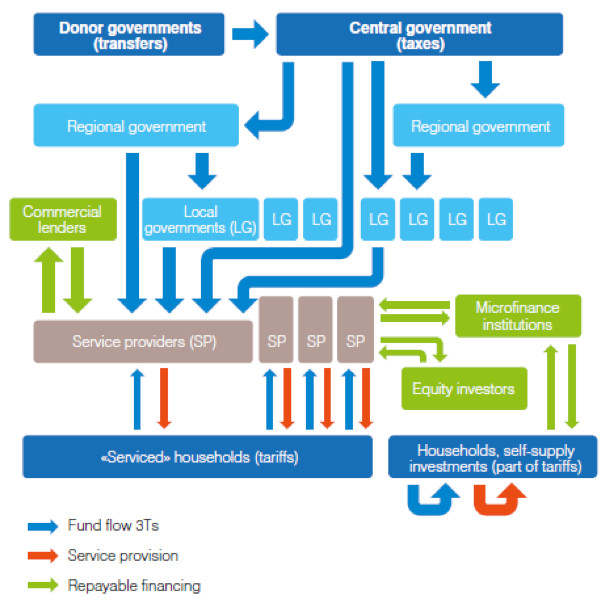
Financing flows The way in which the main financing streams (e.g. taxes, transfers and tariffs) typically circulate in the water and sanitation sector is depicted in figure 2. The main actors involved are the water, sanitation and hygiene service providers, households and domestic governments and development partners.
The dark blue boxes show the financing sources and the light blue boxes show the financing channels for public funding (note that the central government or its agencies may play the role of both financing source and financing channel at the same time) (GLAAS, 2012).

What is missing in the overview of figure 2 (see above) are transfers from donors other than governments such as charitable foundations (including NGOs, decentralized cooperation or local civil society organizations or individuals) to individuals, households, service providers and different levels of governments.
Financing sources and costs of water and sanitation service delivery
IRC International Water and Sanitation Centre presented a generalisation (Pezon et.al, 2010, page 7) of how the costs of water and sanitation service delivery are covered by the main sources of financing.
| Capital Expenditure (CapEx) | Operational and Minor Maintenance Expenditure (OpEx) | Capital Maintenance Expenditure (CapManEx) | Expenditure Direct Support (ExpDS) | Expenditure Indirect Support (ExpIDS) | Cost of Capital (CoC) | |
| Construction of new system | Tariffs Transfers |
Tariffs | Transfers | Tariffs Transfers Taxes |
Tariffs | |
| Existing system | Tariffs | Tariffs | Taxes | Transfers | Tariffs | |
| Upgrading existing system | Transfers | Tariffs | Taxes | Transfers | Tariffs |
As shown in table 1 (see above), tariffs are mostly used to cover operations and minor maintenance expenditure and the cost of capital. Transfers are mostly focused on capital expenditure and indirect support. Taxes are used to cover direct support. Capital maintenance is underfunded.
Financing sources in Europe
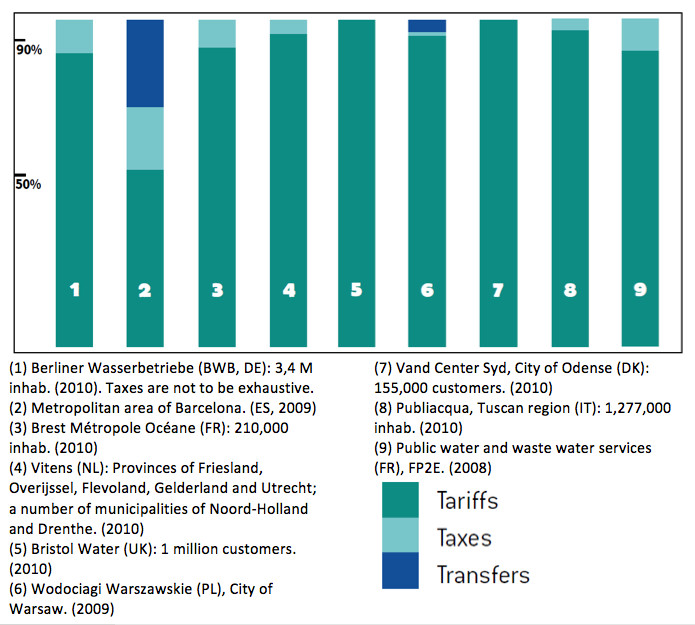
In 2012 the Ecologic Institute undertook an analysis of financing streams in the water sector in eight European countries. Figure 2 shows the percentage of the tariffs, taxes and transfers as in the overall budget (DANVA et.al, 2012).
to water sector in 8 European countries in percentage (%)
Key documents
- Fonseca, C. and Cardone, R., 2003. Financing and cost recovery. (Thematic overview paper / IRC ; 7). The Hague, The Netherlands: IRC International Water and Sanitation Centre
- Hervé-Bazin, C., 2012. http://celinehervebazin.files.wordpress.com/2012/03/eureau-3ts-short-guide-version-internet.pdf ‘3Ts’: tariffs, taxes and transfers in the European water sector: short guide]. Brussels, Belgium: EUREAU
- Norman, G., Fonseca, C. and Jacimovic, R., 2012. Financing water and sanitation for the poor: six key solutions. (Water and Sanitation for the Urban Poor: Discussion Paper; DP#003). The Hague, The Netherlands: IRC International Water and Sanitation Centre and London, UK: Water and Sanitation for the Urban Poor (WSUP)
- OECD,. 2009. Managing water for all: an OECD perspective on pricing and financing: key messages for policy makers. Paris, France: OECD
- Pezon, C., Fonseca, C. and Butterworth, J., 2010. IRC Symposium 2010 Pumps, Pipes and Promises: background paper: pumps, pipes and promises: costs, finances and accountability for sustainable WASH services. The Hague, The Netherlands: IRC International Water and Sanitation Centre.
- WHO and UN-Water, 2012. UN-Water global annual assessment of sanitation and drinking-water (GLAAS) 2012 report : the challenge of extending and sustaining services. Geneva, Switzerland: World Health Organization (WHO)
- Winpenny, J., 2011. fwg primer on financing 2011.pdf Financing for water and sanitation: a primer for practitioners and students in developing countries. Stockholm, Sweden: The European Union Water Initiative Finance Working Group, EUWI-FWG.
Links
- IRC International Water and Sanitation Centre is a knowledge broker, innovator and catalyst of change within the water, sanitation and hygiene (WASH) sector working internationally and in selected focus countries and regions. IRC seeks to extend WASH services to the less privileged, while ensuring that services are based on the sustainable use of water resources, are appropriately managed, and are better governed. IRC works in partnership with governments, the public and private sector, Dutch and international organisations, UN institutions, development banks and non-governmental networks and organisations. For more information see irc.nl and irc.nl/financing
- Global Analysis and Assessment of Sanitation and Drinking-Water (GLAAS) is produced every two years by the World Health Organization (WHO) on behalf of UN-Water. It provides a global update on the policy frameworks, institutional arrangements, human resource base, and international and national finance streams in support of sanitation and drinking-water. For more information see who.int/water_sanitation_health/publications/glaas_report_2012/en/index.html.

